Mistral Large 4 NVFP4 on 8× RTX PRO 6000, TP=8: OOM root cause and a concurrency sweep
One on-prem node, one model: Mistral-Large-4-1T-A52B-NVFP4, ~1T total / 52B active MoE params, 1M context, served by vLLM behind a LiteLLM proxy.
The sweep was run with aiperf 0.13.0, pip-installed into a venv. Every number below was read back from the per-sweep exports (sweep-c*/profile_export_aiperf.json) or from the engine journal in the same session.
Hardware and deployment, as logged
- 8×
NVIDIA RTX PRO 6000 Blackwell Max-Q Workstation Edition(DCGM metric line), 95.06 GiB usable per GPU,world_size=8, tensor-parallel 8. Compute capability 12.0: the journal showsSymmMemCommunicator: Device capability 12.0 not supportedon every worker — no symmetric-memory interconnect in use, so TP=8 runs over PCIe. - vLLM
v0.1.dev23641+gbd4fa2633.PYTORCH_CUDA_ALLOC_CONF=expandable_segments:Truein the unit environment. - KV cache dtype
fp8_ds_mla, speculative decodingdsparkwith 3 speculative tokens, dtype bfloat16. In the journal window the spec-decode metrics read mean acceptance length 2.24–4.00, per-position acceptance 0.61–1.00. - Proxy (LiteLLM) config:
drop_params: true,max_retries: 0,max_input_tokens: 360448, model aliasml4.
The crash: 792 MiB MoE workspace, less than 1 GiB free
The first deployment crashed repeatedly. The journal shows a series of MemoryError events between 18:12:34 and 19:07:15 on 2026-11-01, every one the same shape:
MemoryError: CUDA out of memory. Tried to allocate 792.00 MiB. GPU 0 has a total capacity of 95.06 GiB of which 751.25 MiB is free.
... File "<unknown>", line 0, in FusedMoeRunner::getWorkspaceInfo(...)
The crashing config was --gpu-memory-utilization 0.98–0.983 --max-num-batched-tokens 8192 --max-num-seqs 32 --max-model-len 204800/262144. --gpu-memory-utilization 0.99 was refused at startup: Free memory on device cuda:X (93.94/95.06 GiB) ... is less than desired GPU memory utilization (0.99, 94.11 GiB).
What this means, concretely: --max-num-batched-tokens is the shared per-step token budget (decode = 1 token/sequence, prefill chunked), and activation memory scales with it. At 8192 batched tokens and util ≥ 0.98 the FusedMoE runner needs a contiguous 792 MiB workspace while under 1 GiB is free. The KV cache was never the constraint: the pool was sized 272,636 tokens at max_model_len 204800 (274,934 at 262144) and KV usage never exceeded 15.1% in the journal window. Raising --max-model-len does not free memory — the KV pool is sized from whatever memory is left.
The stable unit that replaced it (deployed, no crashes since, and the one the sweep below ran against):
vllm serve /models/mistral-large-4-nvfp4 \
  --config-format mistral --load-format mistral --served-model-name ml4 \
  --tensor-parallel-size 8 --kv-cache-dtype fp8_ds_mla \
  --max-model-len 256000 --max-num-batched-tokens 4096 --max-num-seqs 16 \
  --speculative-config '{"method": "dspark", "num_speculative_tokens": 3}' \
  --gpu-memory-utilization 0.97 --dtype bfloat16 \
  --disable-custom-all-reduce --disable-flashinfer-autotune \
  --reasoning-parser mistral --tool-call-parser mistral --enable-auto-tool-choice \
  --api-key ${VLLM_API_KEY} --host 0.0.0.0 --port 8000
That leaves ≈3 GiB/GPU of headroom, about 4× the 792 MiB workspace. Corroborated from the client side: at c16–c64 the measured effective decode concurrency has p50 = 16.0, i.e. the engine caps running sequences at max_num_seqs 16.
Measurement procedure
Fixed-output-length sweep, 300 s per point, run against the public chat endpoint through the proxy (URL and key redacted). This is the exact loop used:
for n in 1 2 4 8 16 32 64; do
  aiperf profile --model ml4 --url https://<llm-endpoint>/v1 --api-key "$LLM_API_KEY" \
    --endpoint-type chat --streaming --tokenizer builtin --use-server-token-count \
    --prompt-input-tokens-mean 512 --prompt-output-tokens-mean 4096 \
    --extra-inputs 'min_tokens:4096' --concurrency $n --benchmark-duration 300 \
    --output-artifact-dir "sweep-c$n" --ui none
done
Recorded in the exports: aiperf 0.13.0, phase type concurrency, duration 300 s (measured 282–308 s per run), grace 30 s, streaming chat, builtin tokenizer, server-side token counts, extra input min_tokens: 4096. Measured input sequence length averaged ≈549 tokens (target 512).
One methodology note that matters: fixed-OSL benchmarks must use --extra-inputs 'min_tokens:4096', not ignore_eos: true. With ignore_eos the EOS token can be sampled; the reasoning grammar then rejects tokens [2, 34] and the request is killed (ParserTooComplex). In the journal window before the flag was introduced there are zero occurrences of ParserTooComplex or grammar rejected. The proxy's drop_params: true passes min_tokens through. Result, verified in the exports: output sequence length was exactly 4096.0 at every concurrency (min = max = 4096, std 0).
Results
All values read from sweep-c*/profile_export_aiperf.json. 155 requests total across the seven runs, 0 errors, 0 cancels.
| concurrency | requests | aggregate out tok/s | per-user tok/s | TTFT p50 | TTFT p99 | ITL p50 | ITL p99 | decode conc (avg) | reasoning share |
|---|---|---|---|---|---|---|---|---|---|
| 1 | 7 | 67.9 | 90.1 | 0.56 s | 0.57 s | 11.7 ms | 12.9 ms | 1.0 | 58% |
| 2 | 10 | 124.1 | 73.0 | 0.60 s | 0.99 s | 13.6 ms | 14.6 ms | 1.7 | 64% |
| 4 | 16 | 198.6 | 59.6 | 0.63 s | 1.78 s | 17.1 ms | 18.6 ms | 3.4 | 64% |
| 8 | 25 | 285.5 | 46.9 | 0.70 s | 3.30 s | 21.5 ms | 24.4 ms | 6.5 | 68% |
| 16 | 32 | 384.8 | 32.2 | 1.59 s | 7.50 s | 31.5 ms | 36.0 ms | 12.4 | 65% |
| 32 | 33 | 409.6 | 32.3 | 98.1 s | 155.6 s | 32.0 ms | 36.2 ms | 12.8 | 50% |
| 64 | 32 | 372.3 | 32.6 | 54.6 s | 150.9 s | 31.8 ms | 36.2 ms | 12.2 | 57% |
What the numbers say
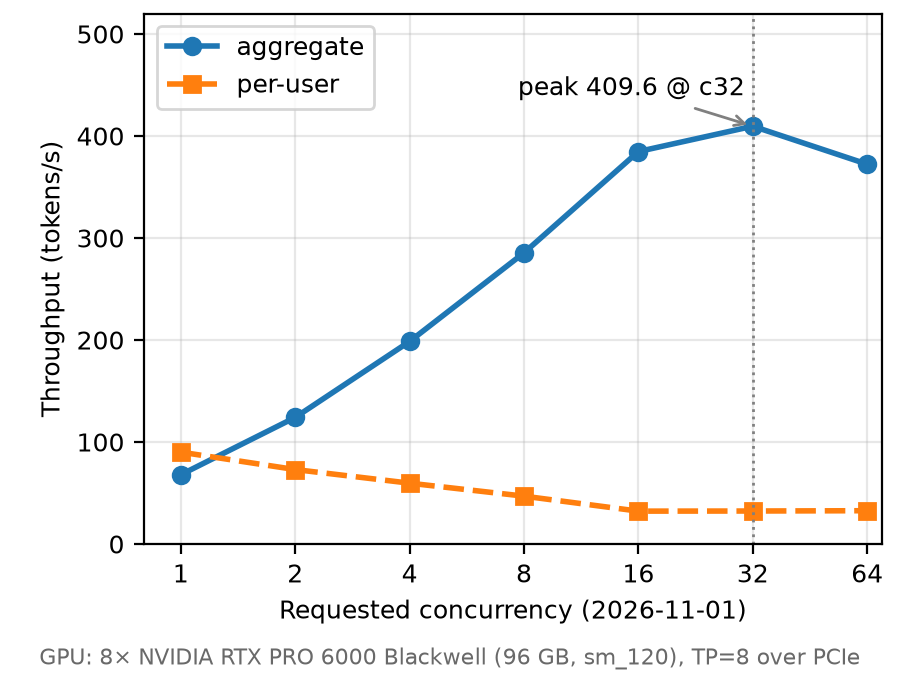
- Aggregate output throughput peaks at 409.6 tok/s at c32 (384.8 at c16, 372.3 at c64). The wall is ≈410 tok/s.
- Per-user throughput falls 90.1 → ≈32 tok/s (c1 → c32/c64); ITL p50 rises 11.7 → ≈32 ms. Decode concurrency averages ≈12.8 and saturates (p50 = 16 =
max_num_seqs). - c16 is the latency knee: TTFT p99 there is 7.5 s. Beyond c32 the extra requests only queue — TTFT p50 is 98.1 s at c32.
- Reasoning tokens are 50–68% of the output at every point, so a large part of the generated tokens is thinking, not answer.
- Interpretation, labelled as such: the ≈410 tok/s ceiling is consistent with decode being memory-bandwidth bound — the NVFP4 weights have to be read on every decode step, and with TP=8 over PCIe (journal shows the symmetric-memory communicator is unavailable on capability 12.0) each step pays host-interconnect traffic. That mechanism was not measured directly; the ceiling itself was.
Practical read: this node is a capacity play, not a throughput play — 8× 96 GB ≈ 768 GB of VRAM and 256k context for a 1T-class NVFP4 model. Single-user latency is fine (90 tok/s, ITL 11.7 ms); if you need more aggregate throughput from this model size, the interconnect is the thing to change, not the flags.
Reproduce / check
- Re-run the loop above; use a unique
--output-artifact-dirper batch and readprofile_export_aiperf.json(keys:output_token_throughput,output_token_throughput_per_user,time_to_first_token,inter_token_latency,effective_decode_concurrency,reasoning_token_count,request_error_rate,output_sequence_length). - Log signatures worth grepping for: OOM =
FusedMoeRunner::getWorkspaceInfo+Tried to allocate 792.00 MiB; grammar kill =grammar rejected tokens/ParserTooComplex; health =GPU KV cache size/GPU KV cache usage,SpecDecoding metrics.
Open items
- Try
--max-num-seqs 32at 0.97/4096; after boot verifyGPU KV cache size≥ 256,000 tokens and noMemoryError. - Proxy:
max_retries0 → 2–3, so a single engine restart does not surface as a client error.
Numbers are from one node, one model, one 300 s sweep per point on 2026-11-01. Your mileage will vary.